Debug Nebari deployment
The beauty of Nebari is that most Dev Ops management is already handled for you. However, there will likely come a time that you will need to debug your Nebari instance. This debug guide contains some tips and tricks to help you in your debug endeavors.
Debugging the Kubernetes Cluster using k9s
If you need more information about your Kubernetes cluster,
k9s is a terminal-based UI that is extremely useful
for debugging. It simplifies navigating, observing, and managing your
applications in Kubernetes. k9s continuously monitors Kubernetes clusters
for changes and provides shortcut commands to interact with the observed
resources. It's a fast way to review and resolve day-to-day issues in
Kubernetes, a huge improvement to the general workflow, and a best-to-have
tool for debugging your Kubernetes cluster sessions.
Setting up k9s for Nebari
First, follow the installation instructions on the k9s documentation.
During the nebari deploy proccesss, the configuration file kubeconfig
will have been autogenerated. If you need to regenerate the configuration, you
can refer to the following section. If you already have this set up, you can
skip to the Getting started with k9s below.
Generating the kubeconfig
- Google GCP
- Digital Ocean
- Amazon AWS
- Azure
For Google GCP (also known as Google Cloud
Platform or GCP), you'll need to have
gcloud installed. The command to
update your kubeconfig for GCP is:
gcloud container clusters get-credentials <project-name>-<namespace> --region <region>
For DigitalOcean,
you'll need to have the
doctl tool
(the Digital Ocean CLI) installed. The command to update your kubeconfig for DO is:
doctl kubernetes cluster kubeconfig save <project-name>-<namespace>
For Amazon Web Services (AWS),
you'll need to have the
AWS CLI
installed. The command to update your kubeconfig for AWS is:
aws eks update-kubeconfig --region <region> --name <project-name>-<namespace>
For Microsoft Azure,
you'll need to have the
azure CLI
installed. The command to update your kubeconfig for Azure is:
az aks get-credentials --resource-group <project-name>-<namespace> --name <project-name>-<namespace>
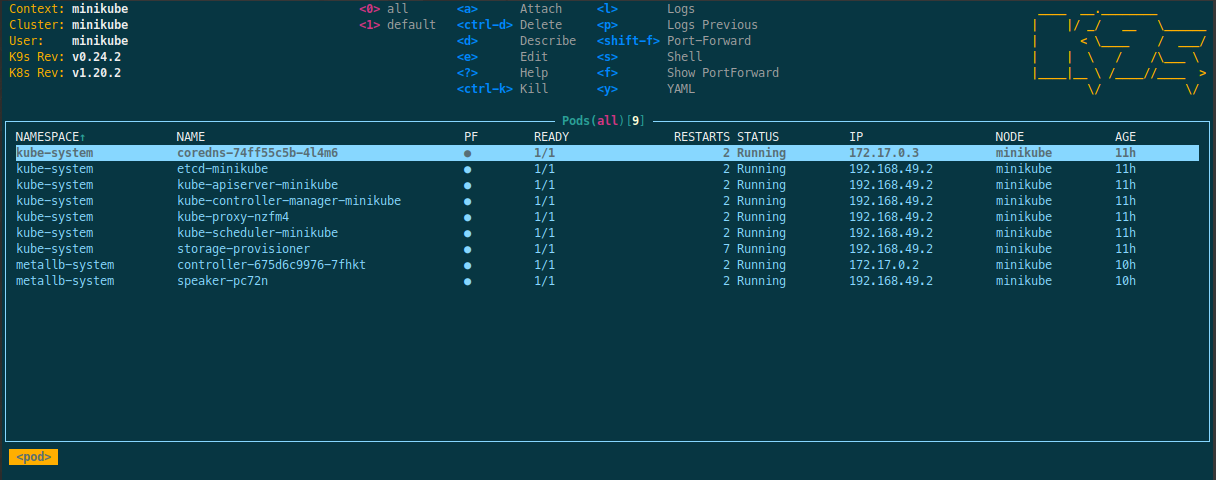
Getting started with k9s
Launch k9s from a terminal on your local machine. It will look for the
configuration in the kubeconfig to dial the connection with the cluster.
To view all the current processes press 0:
Using k9s you can inspect any services launched by your cluster. For
example, if your cluster has problems with the network traffic tunnel
configuration, it may limit or block a user's access to destination resources
such as files or workers, using k9s you can inspect the network
configuration as well as the connection logs.
From within k9s, the port-forward keystroke, shift + f, allows you to access and interact with your Kubernetes cluster from your local machine. You can then use this method to investigate issues and adjust your services locally without the need to expose them beforehand.
Let's suppose you are deploying a new service to Nebari, and would like to quickly debug any connection related problems around it, for example a 404 Error. With port-forwarding you can attest if the origin of the problem lies within the service itself or with the networking aspects of the connection, for example an Ingress route misconfiguration. This allows you to check the service status without any extra modifications to its structure.